finite-element model and boudary condition
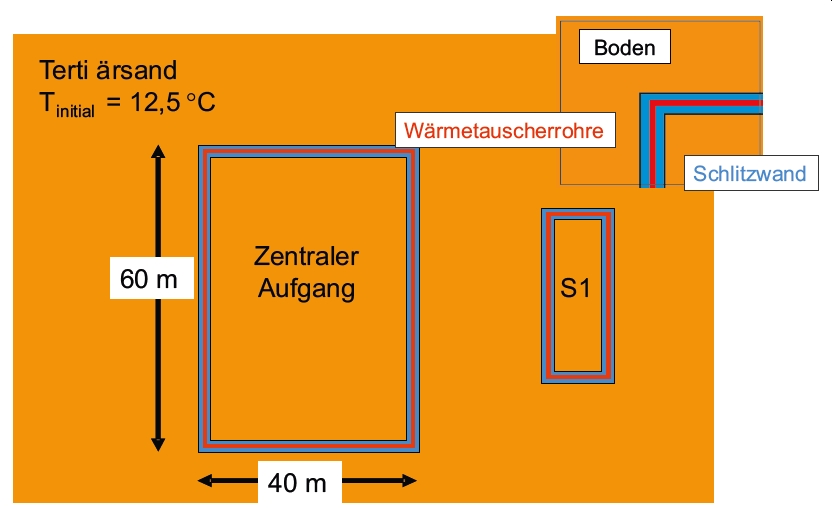
Schematic scetch of 2D model. Heat flux exchange surface has been
realised using flux boundary condition.
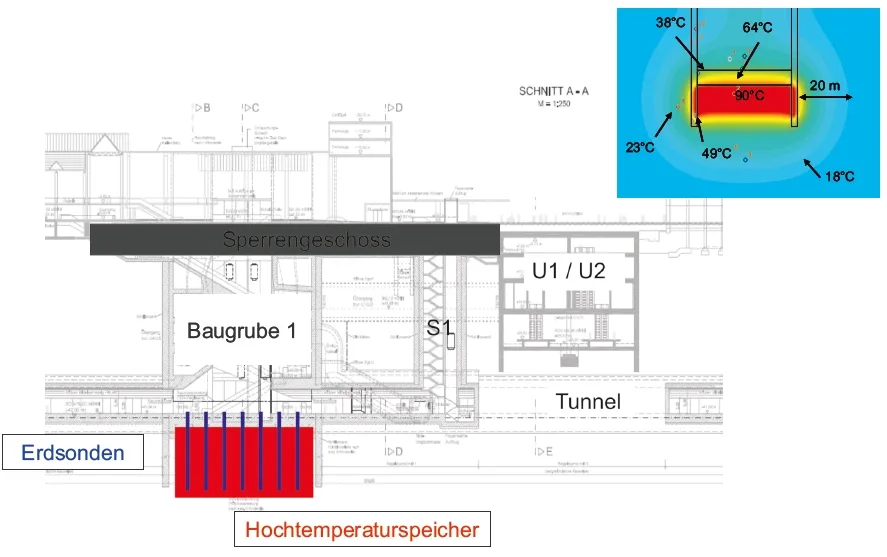
temperature distribution

Temperature distribution in quaternary / tertiary 1. Basis of calculation is
a heat flux of 7 W/m² over 365 days. Ground water flow has been included.
temperature hydrograph of soil

Resulting temperature hydrograph out of 2D FE-simulation.
Representative points of calculation are shown.
time variable heat flux
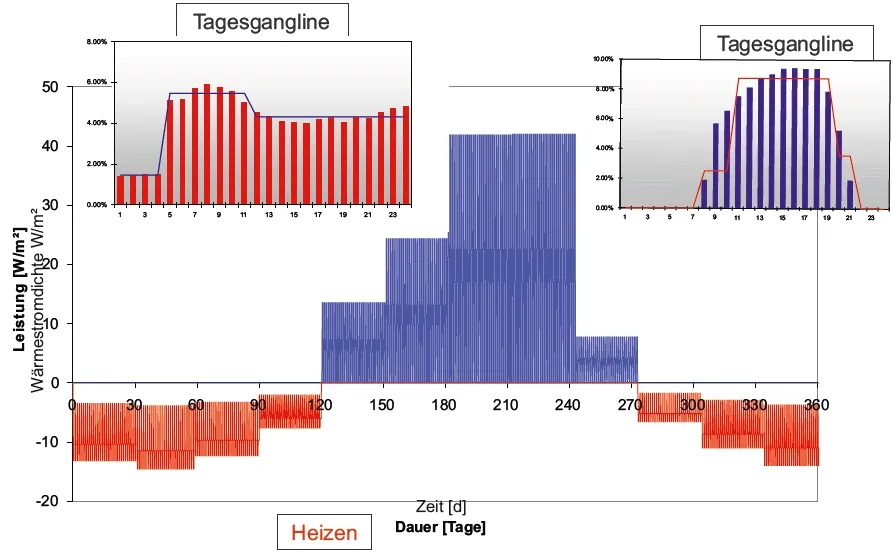
Time variable heat flux. Simulation uses energy hydrograph of
“Hauptbahnhof München”